Southern New Hampshire University • 6 min read
AI-Powered Prior Learning Assessment
Designing a machine learning tool with Google, and taking multi-course matching from under 30% to over 90% task success.
90%+
Multi-course match success
Up from under 30% after I redesigned the matching flow
81.8%
Of testers saw clear value
Said it would improve on their current process
200+
Colleagues briefed
I presented the research and design at the company retreat
- Role
- Lead Product Designer
- Timeline
- Aug 2022 – Aug 2023
- Team
- 6 people
- Partners
- Google and the Bill & Melinda Gates Foundation
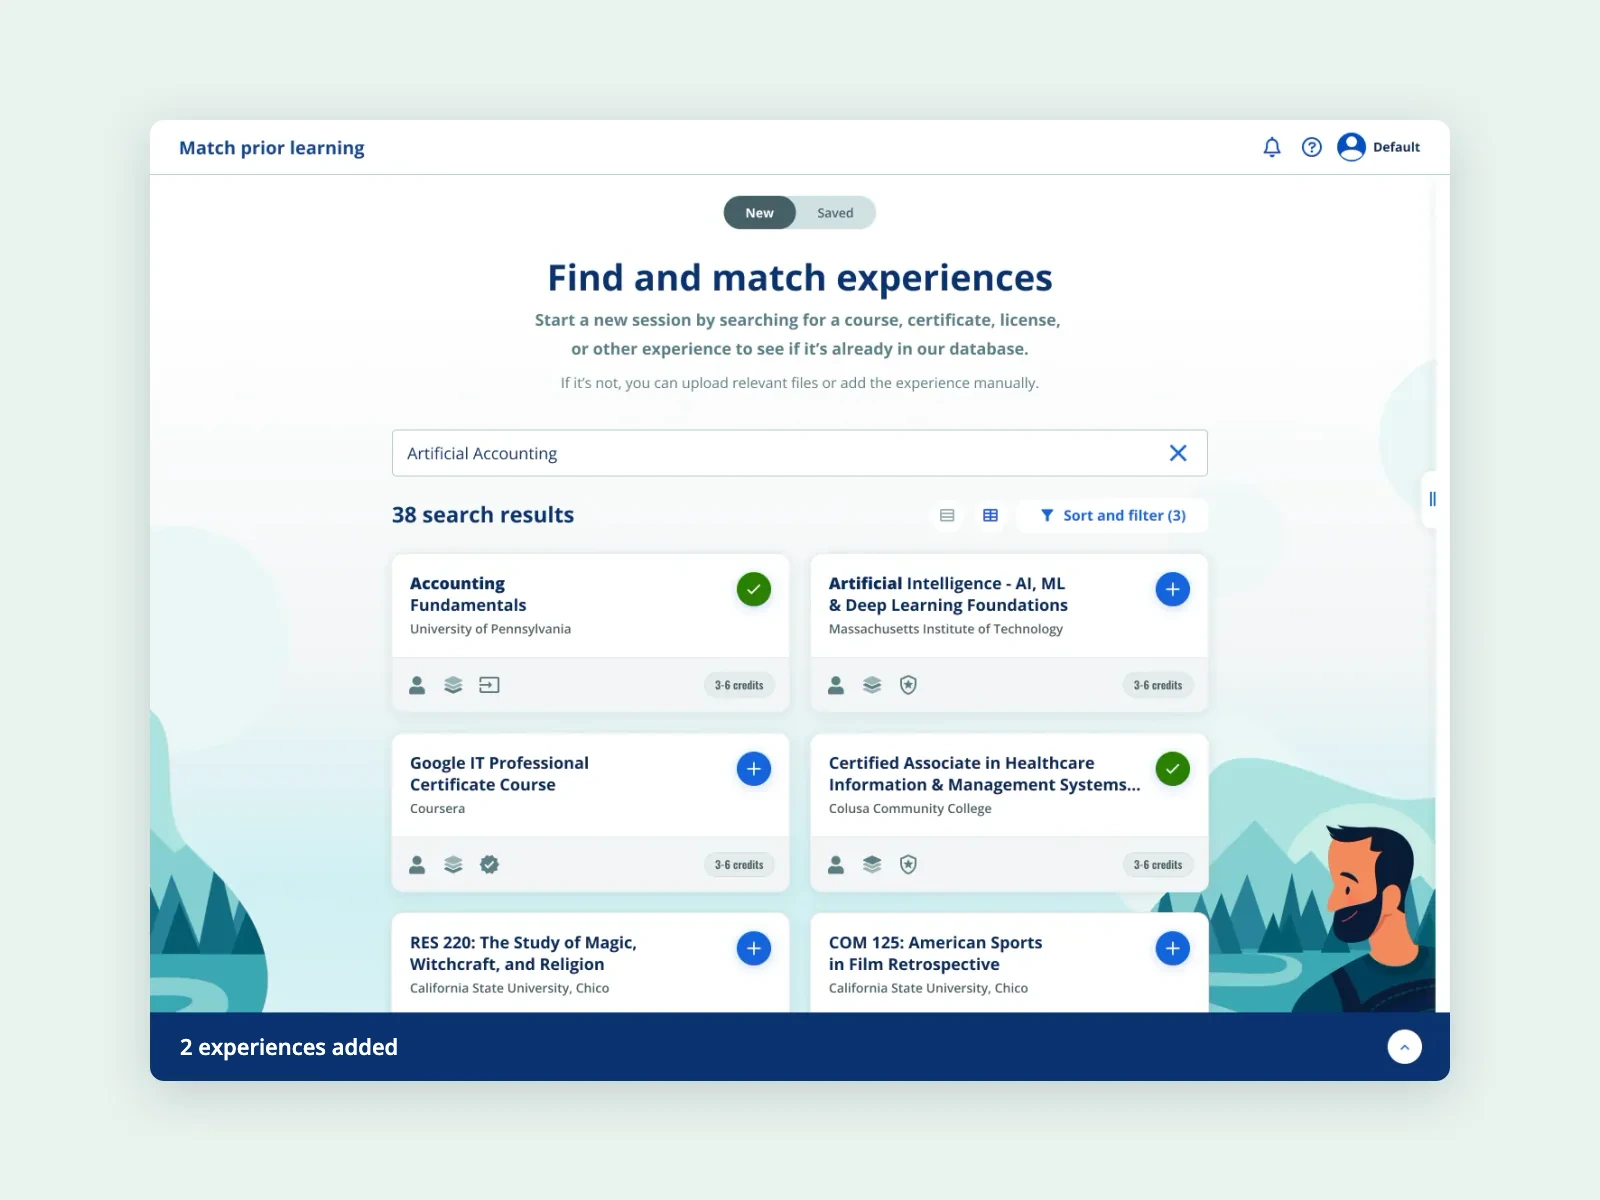
Adult learners bring credit-worthy experience from work, the military, and certifications. At SNHU, evaluating it meant emails and comparing every document to the course catalog by hand. With Google and the Bill & Melinda Gates Foundation, we set out to build a machine that does the matching. I led the design from the first interviews to the alpha launch.
Challenge
A slow, manual process
- Requests arrived by email, with no central record of history or notes
- Analysts checked every document against the catalog by hand
- Learners weren’t getting all the credit they had earned
Solution
One AI-assisted workspace
- Every data source and the approval process in one tool
- Google’s machine learning parses documents and suggests matching courses
- Staff compare suggestions side by side and choose the closest match
Build for staff, design for students
I recommended building for staff first, so student features could grow into the same product.
SNHU’s mantra was to think of the student first, and I wrote a full feature spec for the student experience. Then I recommended we build for staff first. A service blueprint showed that staff who know the tool become the best support learners can get, and a staff-only release gave us a clear audience to test with. Student and employer features could grow into the same product later, instead of separate apps.
Flow first, then the look
Complex interactions had more than one possible solution, so I started on paper. The first sketches explored a stepper, which the final version dropped. Low-fidelity wireframes then broke each complex interaction into its own parts. With our junior designer, I prototyped the high-fidelity wireframes as we designed them, so testing could start sooner.
The design system team set the fonts, colors, plus card designs. Their components dropped straight in, so I could test several high-fidelity ideas quickly. Where the system fell short, I came up with new pieces, then designed them with the team: a card subline for an experience’s type or completion date, a filter slide-out, plus the experience drawer. I presented each round to the departments for feedback.
The machine suggests, people decide
Credit decisions affect people’s degrees, so the machine doesn’t award credit on its own.
It suggests SNHU courses and shows its reasoning. Staff make the call. For the comparison, I chose a table like the ones people use to weigh software or pricing plans, so staff needed no new training. It also lets them scan several courses at a glance. The design system team designed its look.
How staff can trust a suggestion
- Every suggestion carries a high, medium, or low strength of fit
- Matching skills, competencies, and outcomes are counted side by side
- Staff choose the closest match themselves
- If nothing fits, they flag the experience instead of forcing a match
Multi-course matching: from under 30% to over 90%
What changed
- Matching moved after the results view, out of the upload flow
- Instant feedback on every uploaded document
- Every required action reviewed in one place
- Harder matches handled at each person’s own pace
- Complex reviews saved and finished later
- Matching tasks
- Other tasks
Rated the task difficult
- Task 110%
- Task 210%
- Task 310%
- Task 410%
- Task 510%
- Task 610%
- Task 710%
- Task 8 · match one course40%
- Task 9 · match several50%
- Task 1030%
Completed the task
- Task 180%
- Task 290%
- Task 390%
- Task 4100%
- Task 590%
- Task 6100%
- Task 7100%
- Task 8 · match one course80%
- Task 9 · match several30%
- Task 1090%
Show the data as a table
| Task | Rated difficult | Neither | Rated easy | Completed |
|---|---|---|---|---|
| Task 1 | 10% | 10% | 80% | 80% |
| Task 2 | 10% | 10% | 80% | 90% |
| Task 3 | 10% | 20% | 70% | 90% |
| Task 4 | 10% | 10% | 80% | 100% |
| Task 5 | 10% | 10% | 80% | 90% |
| Task 6 | 10% | 10% | 80% | 100% |
| Task 7 | 10% | 20% | 70% | 100% |
| Task 8 · match one course | 40% | 0% | 60% | 80% |
| Task 9 · match several | 50% | 0% | 50% | 30% |
| Task 10 | 30% | 0% | 70% | 90% |
Rounded to the nearest 10%, as charted in the original research readout.
Staff from Admissions, the Registrar’s office, and other departments found the first prototype intuitive. Matching was the exception: 80% completed a single match, but fewer than 30% could match several courses at once, and 40–50% rated matching difficult.
“I know if I had anything like this when I was in ESS, I would have been ecstatic.”
Prototype for each audience
I built two prototypes for two audiences: an alpha that scoped the MVP for engineering, and a beta that showed stakeholders the full V1. My front-end background let me work through problems with our tech leads in their terms. I split the files by sub-epic, redlined every component state, and joined grooming twice a week. With Google, I worked out how matches are scored and what document parsing needed.
Outcomes
Before launch, I presented the research and design to 200+ colleagues at the company retreat, including senior leadership. We also demoed the tool for every department. The alpha went to Admissions and Registrar staff in August 2023. It’s an internal tool and I left SNHU after the alpha, so I don’t have production numbers.
How we planned to measure it
- How often staff agreed with the machine’s matches
- New matches staff wouldn’t have found on their own
- Where the match staff chose ranked among the suggestions
- Time to evaluate each request
This tool is an incredible value-add for my role as a Prior Learning Analyst. It will impact my day-to-day in such a positive way.
What I learned
- Utilitarian tools still need moments of joy. Course matching can take a minute or two, and staff see that wait often. My concept: a single document comes in, breaks into parts, then each part gets sorted and matched. The parts of the machine are interchangeable, so every run plays out at random, yet each is right-sized to fill however long matching takes. I fleshed it out with our motion designer, who designed and animated it as a Rube Goldberg machine.
- Illustrations matched to each task, drawn by another designer on the team, did more than add visual appeal. They made a utilitarian product feel light and friendly.
Team
I led design for the whole project, starting alone with the product owner on the research, problem statements, feature spec, and first flows. A junior designer joined after the low-fidelity stage, working with me on research and high-fidelity design. The design system team owned the visual language, while teammates created the illustrations plus motion. I was promoted to Lead Product Designer in June 2023, once the designs were complete and the tool was in development.
Nancy D.
Product Owner
Nicole C.
Product Manager
Joshua H.
Data Analyst
Angelika K.
Researcher
Krista S.
Junior Designer